Categories: Advanced
Swept Frequency Capacitive Touch
The human body has an external resistance in the range of 1KW – 100KW, an internal resistance of 300W – 1KW and a capacitance in the range of 100 – 200 pF [6]. When a body comes into contact with an electrode, a capacitive link is formed between it and the ionic physiologic fluids in the body[7]. Furthermore, there is a capacitive link that is formed between the user and ground which depends on the shoes that the user is wearing. In this way the human body allows the flow of an AC signal to ground.
The Touché concept utilizes the principle that impedance in a circuit with capacitive and inductive elements is dependent on frequency. Since the human body is capacitive it is possible to arrange circuit elements in such a configuration that by touching an electrically coupled electrode an object creates a detectable change in the voltage profile of the circuit.
There are numerous factors that determine the electrical influence that a human body has on the circuit which include; whether the person is wearing shoes or not, the specific resistance and capacitance of the user and most notably the AC frequency of the signal that is injected into the system. There are a number of systems that exist that utilize the frequency dependent impedance property of the human body in order to detect interaction at a single AC frequency [8][9]. However, by continuously sweeping over a range of frequencies it is possible to gain a large amount of insight into how an object is being grasped.
By sweeping through a range of frequencies the dimensionality of the system is extended from a binary sensor to a two dimensional, spacial and temporal profile with a far larger number of unique data configurations.
There are two notable implementations of the swept frequency capacitive touch sensor the first of which, Touché, has already been mentioned. The second implementation was based on an Arduino MCU[10] and it sought to investigate the feasibility of implementing a sensor using limited hardware. The main difference between the two systems was the quality of the swept frequency signal that was produced. In order to account for the poor signal quality, the Arduino system sampled the voltage levels after the biasing inductor, this reversed the circuit properties and resulted in an inverted notch filter from which peak voltage level analysis was conducted in order to determine manipulator pose. Whilst the implementation was successful it did not have the resolution of the original system and was therefore non-optimal for this implementation.
Wave Generation
The AD5932 wave generator was chosen as the IC to create the desired swept frequency signal needed for the CapTouch application. The module has a max frequency output of 25 MHz and a 10 bit resolution. The peak output voltage has a maximum value of 580mV with an offset of 56mV and therefore needed to be amplified in order to increase the system resolution. The gain of the op-amp was therefore chosen such that the signal had a peak to peak voltage of 2V. The signal could not be amplified further due to the input voltage limit of the Nordic MCU.
Unfortunately, due to time constraints and the delayed delivery of the AD5932 wave generator IC, use of the chip was abandoned and was substituted by the Rigol DG1022 20Mhz waveform generator. This unit, unfortunately, had a large form factor rendering the system unportable. Despite this substitution the system was configured to simulate the AD5932 as accurately as possible such that its use did not significantly alter the performance of the system.
Sensing Circuitry
The sensing part of the circuit was essentially a notch filter. During operation the electrode was connected to the object of interest and the human user was modelled as a capacitor between the electrode and ground. The inductor acted the high pass component of the circuit and the capacitor acted as the low pass component. The combination of the inductor and capacitor defined the center frequency of the notch filter and since capacitance was largely an uncontrollable feature that was determined by the inherent capacitance of the human body, the inductor was carefully chosen in order to set the notch in the appropriate frequency range.
Initial component testing with an inductor value of 150mA positioned the center frequency around the 30KHz range, however it was found that there was substantial noise interference at these lower frequencies. The more contact that was made with the electrode the more capacitance was induced into the system and as a result the center frequency was shifted towards the lower frequencies. In order to avoid moving the notch into the high noise area the starting center frequency was shifted such that the minimum expected center frequency was 250Khz. Assuming that human capacitance is in the range of 100 – 200 pF it was possible to use the center frequency formula in order to determine an appropriate inductor value.
The sensing resistor situated at the output of the opamp widened the notch of the filter. The higher the value the greater the bandwidth of the notch filter. It was initially thought that a greater bandwidth would result in profiles that were easier to characterize, however this was not the case and a smaller bandwidth corresponding to a sensing resistor value of 1kΩ was chosen over the original 10kΩ. The notch filter section of the system was designed and simulated in LTSpice as shown below.
The envelope detector is the next section of the system and it serves to convert the offset AC voltage into a time varying DC signal that can be sensed by the microcontroller. It can be thought of as a low pass filter in the downstream (positive) direction and an all pass filter in the other direction. Envelope detectors do not handle sharp changes or square waves well due to negative clipping or lagging behind the waveform. However, since the AC signal was swept over a wide range in relatively small increments, the impedance changes were not too severe and there was a relatively continuous notch path that the envelope detector could identify.
System Diagram
Collecting Profiles
The nRF51 mbed board was responsible for the external trigger for the swept frequency wave generator as well as for the sampling of the capacitive profiles generated by the output of the envelope detector. Upon receiving the trigger signal, the wave generator swept through frequencies from 100kHz to 2MHz in a total of 60ms. The initial approach was to have the Beaglebone collect the data; however, despite the onboard processor (TIAM3358) sampling rate of 200kHz [9], the actual time required to collect and store 200 data points was much less than this. It was suspected that because the processor on the Beaglebone was not running in real time, the ADC collection task was being preempted by other processes on the board, resulting in a total time of 550ms to collect 200 data points. This was clearly an issue considering the fact that the wave generator was only sweeping over 100ms.
Using these profiles to distinguish between four touch configurations was clearly insufficient, as the resolution was much too low to be able to capture any distinct minima. Among the four touch configurations shown in Figure 3a above, only the boundary cases of no touch and full metal grip could be consistently classified. Due to the ADC speed, only the first 25 sample points represented significant features. Figure 3b below truncates the remaining points to focus on the these significant features, showing that the one finger and full grip case show nearly identical capacitive profiles and minima that were virtually indistinguishable to the classifier.
There were two feasible options to improve the data collection rate. One was to utilize the Beaglebone’s Programmable Real-Time Unit Subsystem (PRUSS). However, upon deciding that the final product would require an mbed nRF51 board to connect via bluetooth to an iOS app for music player controls, it was decided that it would be beneficial to offload data collection onto the mbed, which would be running the single data collection task when data collection was initialized. The result was a significant improvement in data collection rate, as it only took the mbed nRF51 17.4ms to collect 200 data points. With this improved resolution, it was possible to identify far more drastic differences in minima that was critical for accurate classification.
For the final design, the trailing steady values in the higher frequency sweep were disregarded since focus was on the minima, thus reducing the number of sample points from 200 to 70 while testing the system in real time. The amount of time needed to collect 70 points was approximately 6.59ms.
System Integration and Communication
To ensure streamlined communication between data collection, classification (discussed in next section), and result broadcasting to the app, the communication sequence was set up as follows, and as depicted in Figures 5a and 5b above:
nRF51 reads the result (a value 0-4) and sends it via bluetooth to the iOS app
only when the value has changed
. The user is required to move his or her hand back to the default configuration (0 : no hands or 4 : two hands on wheel) between each touch command in the same way a push button is required to return to its non-activated state between commands.
- nRF51 is in spin mode while waiting for an interrupt from Beaglebone
- Beaglebone sends “send_ready” interrupt to nRF51 to tell it to begin collecting and sending each data point as a string over UART, and pulses the DTR signal
- nRF51 pulses the trigger to wave generator to initialize the frequency sweep
- Beaglebone collects each point as it comes in, converts to a float, and appends it to an array to be processed
- nRF51 is in spin mode waiting for Beaglebone to run classification algorithm
- Beaglebone classifies the profile into 1 of 5 touch configurations
- Beaglebone sends “touch_ready” interrupt to nRF51 to tell it that classification has finished and that the resulting value is to be read
Classification of Profiles
Classification of profiles was done using a Support Vector Machine within the Python SciKit library. On a basic level, a Support Vector Machine defines “separating hyperplanes” to separate clusters of data such that the distance from each of the points to each of its bounding hyperplanes are minimized.
In a two-dimensional space such as that depicted in Figure 6a, the SVM classification algorithm involves finding the largest margin (distance between separating hyperplanes) that divides clusters of points. SVMs are also effective in higher dimensions, and thus became the classifier of choice for this application.
The training data consisted of 10 sets of 70 samples for each of the 5 configurations. It is important to note that for the one finger, two finger, and full grip positions, samples were taken with one hand executing the command and the other hand on the steering wheel since it was assumed that, for safety reasons, the user would keep his or her hand on the wheel when executing media touch commands. Each set of 70 samples was associated with its expected output.
The first step in training was to declare a SVC classifier. The parameter C is the penalty factor and controls how "hard" or "soft" the margin is [10]. An infinitely high value of C will create a rather narrow margin separating the training data, thus creating an overfitting classifier. In this application, a low value of C=1.0 was applied to allow for softer margins. Figure 6b depicts the outcomes of applying an overfitting classifier versus a more ideal classifier in a 2-D space.
clf = svm.SVC(kernel = 'linear', C=1.0)
Next, the training inputs needed to be scaled. Scaling is necessary to avoid the issue of numerically higher valued inputs dominating lower valued inputs, due to inner product operations when computing the linear kernel function K( x(i) , x(j) ) = [
x(i)
^T][
x(j)
].
Because the ADC values are already between 0 and 1, data is already scaled as necessary for the classifier. Now the inputs and outputs just need to be fit to the classifier.
clf.fit(training_input, training_output)
The training score, which is indicative of training data quality and ability of the classifier to differentiate between all cases, could be obtained using:
clf.score(training_input, training_output)
The training data provided produced an ideal training score of 1.0. To test the classifier, the predict() function was called for each set of data collected while the system was live:
result = clf.predict(data_float)
Where data_float is the list of 70 floats collected from the mbed board.
Results and Verification
The steering wheel system was tested by tracking the results of 20 tests at each touch configuration, with a varying amount of surface area in contact with the steering wheel while in that configuration. The outcomes showed a 100% accuracy at the no touch, full grip, and two hand grip on rubber configurations. The classifier produced less accurate results for the one finger (80% accuracy) and two finger (85% accuracy) touch configurations. The misclassification for these states can be attributed to the fact that it is easy to produce overlapping waveforms between the one and two finger touch configurations due to a similar skin surface area applied onto the steering wheel while in those configurations, thus also creating nearly identical capacitances to ground.
The confusion matrix above collected outcomes of the classifier only during steady state. Because the functionality of the app depends on the change in touch position, it was also important to test the accuracy of the system during transient phases when changing from the no touch or two hand grip configurations to the remaining positions. The ideal outcome would be that the waveform cleanly shifted back to no touch or two hand grip after issuing a one finger, two finger, or full grip on metal command. No touch and two hand grip were the default no-command states since they were not associated with any media player command. An example of a non ideal outcome would be when a user is likely to apply a momentarily smaller capacitance to ground when lifting two fingers from the steering wheel after a touch command. This momentarily change in capacitance would shift the minima (center frequency of the notch filter) of the capacitive profile rightwards towards attenuation at a higher frequency, causing the configuration to potentially be classified as a one finger touch on the steering wheel (see above figure). The transient period was defined to span 2 sample sets (70 points each) immediately after the configuration change.
As expected, the transient period inaccuracy mostly affected the one finger and two finger cases since they were most similar to each other. There was also an expected trade-off between latency and classification accuracy during the transient period. Because classification accuracy in the transient period was important in this application, it was prioritized over reducing latency. A 0.2s delay was added between each data collection set, bringing our total classification update rate to be 5Hz.
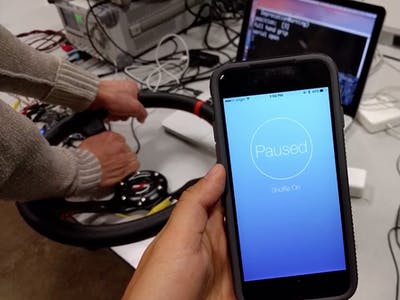
CapTouch iOS Application
The steering wheel system interfaced with an iOS application for relaying the touch commands to the media player. One finger touch skipped to the next song, two finger touch toggled shuffle mode, and full grip on the metal portion of the steering wheel toggled pause/play. A touch configuration of no touch or two hands on the steering wheel indicated no action to be taken on the app.
As with all Bluetooth Low Energy systems, the iOS app employed an event-driven structure. As mentioned previously, it only received updated touch configurations, that is, the nRF51 only sent touch configurations when it was different from the previous configuration. Therefore, it was expected that a user would release his or her hand from the touch interface before issuing another command so that all actionable touch commands were preceded and followed by non-commands.
Conclusion
CapTouch enables any arbitrary object to be turned into a capacitive touch interface. As has been shown the system was able to successfully differentiate between 5 different hand grips on the example interface of a steering wheel. These hand configurations were used to control a music playing app on an iPhone that substituted a car’s media system. With an 80% accuracy rating the system does not have the exactness of a regular push button however CapTouch does have the advantage of being rapidly deployed by simply attaching the electrode to the desired interface and powering the system on.
As previously mentioned the sensing resistor that is part of the notch filter determined the corner frequencies of the low and high pass filter components and therefore the bandwidth of the notch filter. As a potential future investigation, in addition to sweeping the frequency it would be interesting to multiplex the signal path through a variety or resistor values in order to give a variety of notches for one particular grip and possibly further differentiate gripping configurations.
References
- [1] SSI Electronics, “TOUCH SCREENS : Design Guide,” 2013. [Online]. Available:
http://www.ssi-electronics.com/resources/pdf/ssi/Touch_Screen_Design_Guide.pdf
. [Accessed: 01-Dec-2016].
- [2] LION Precision, “Capacitive Sensor Operation and Optimization,” 2015. [Online]. Available:
http://www.lionprecision.com/tech-library/technotes/tech-pdfs/cap-0020-cap-theory.pdf
. [Accessed: 01-Dec-2016].
- [3] L. K. Baxter,
Capacitive Sensors: Design and Applications
. John Wiley & Sons, 1996.
- [4] J. V Chamary, “3D Touch In iPhone 6S Isn’t Just A Gimmick. Here’s How It Works,” 2015. [Online]. Available:
http://www.forbes.com/sites/jvchamary/2015/09/12/3d-touch-iphone-6s/#255d9420abc0
. [Accessed: 01-Dec-2016].
- [5] M. Sato, I. Poupyrev, and C. Harrison, “Touché: Enhancing Touch Interaction on Humans, Screens, Liquids, and Everyday Objects,”
Proc. SIGCHI Conf. Hum. Factors Comput. Syst.
, no. c, pp. 483–492, 2012.
- [6] P. E. Schoen, “CAPACITANCE OF A HUMAN BODY,”
Extreme Electronics
, 2015. [Online]. Available:
http://www.extremeelectronics.co.uk/capacitance-of-a-human-body/
. [Accessed: 01-Dec-2016].
- [7] H. C. Foster and K. R. Lukaski, “Whole-body impedance – what does it measure?,”
he Am. J. Clin. Nutr.
, vol. 64, no. 3, pp. 388–396, 1996.
- [8] "1.4. Support Vector Machines." Support Vector Machines: Scikit-learn 0.18.1 Documentation. Scikit-learn, Web. 07 Dec. 2016. <
http://scikit-learn.org/stable/modules/svm.html#svm-kernels
>.
- [9] "AM3359 (ACTIVE)." AM335x | ARM Cortex-A8 | Online Datasheet. Texas Instruments, n.d. Web. 07 Dec. 2016. <
http://www.ti.com/product/AM3359/datasheet
>.
- [10] Hsu, Chih-Wei, Chih-Chung Chang, and Chih-Jen Lin. "Support Vector Machines for Classification."
Support Vector Machines Information Science and Statistics
(n.d.): 285-329. National Taiwan University, 19 May 2016. Web. <
http://www.csie.ntu.edu.tw/~cjlin/papers/guide/guide.pdf
>.
Comments are not currently available for this post.